Robert Feldmann
Associate Professor | Department of Astrophysics, UZH
Scripts
- Fitting SFR distributions (incl. zero-inflated negative binomials), see Feldmann 2017: R script, catalog converter
LEO-Py
Incomplete and uncertain observational data, such as those arising from detection limits and measurement uncertainties, are commonplace in astronomy and astrophysics. Unfortunately, many standard techniques are not well equipped to deal with such data sets potentially resulting in strongly biased or even inconsistent estimates of the underlying model parameters. The Likelihood Estimator for Observational data with Python employs Gaussian copulas to decouple the correlation structure of variables and their marginal distributions resulting in a flexible method to compute likelihood functions of data in the presence of measurement uncertainty, censoring, and missing data. LEO-Py is available as an open-source Python package on GitHub and the Python Package Index.
ZEBRA
The Zurich Extragalactic Bayesian Redshift Analyzer is a publicly available, open source software package that computes photometric redshifts with outstanding accuracy. A detailed description of the approach adopted by ZEBRA can be found in Feldmann et al. 2006. You can clone ZEBRA directly from its bit-bucket repository.
Gallery
Movies
|
|
|
|
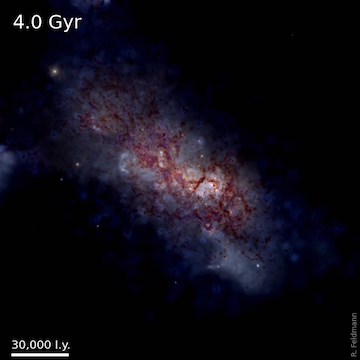
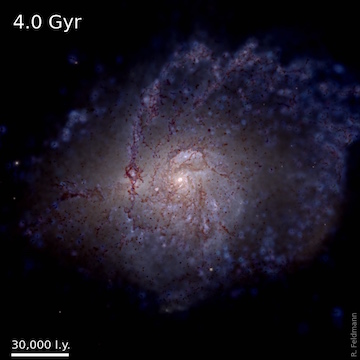
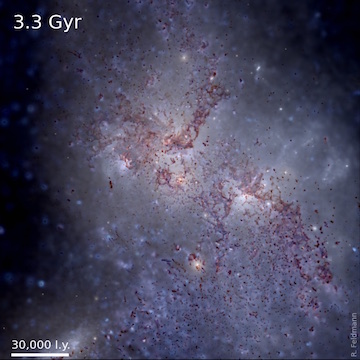
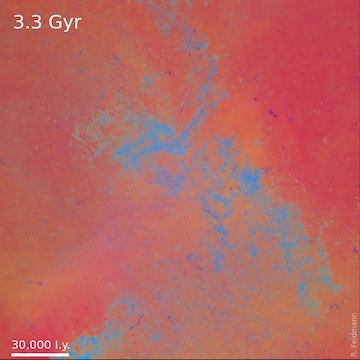
Examples of MassiveFIRE galaxies. Panels in the top row and at the bottom left show composite U, V, and J band images that account for dust absorption. The panel at the bottom right shows the gas distribution for the galaxy in the bottom left panel in false colors: blue, green, and red denote density, gas metallicity, and gas temperature. For instance, hot diffuse gas is shown in red, dense, metal rich gas in cyan, and dense, unenriched gas in a dark blue. [each movie is about 12 MB] |
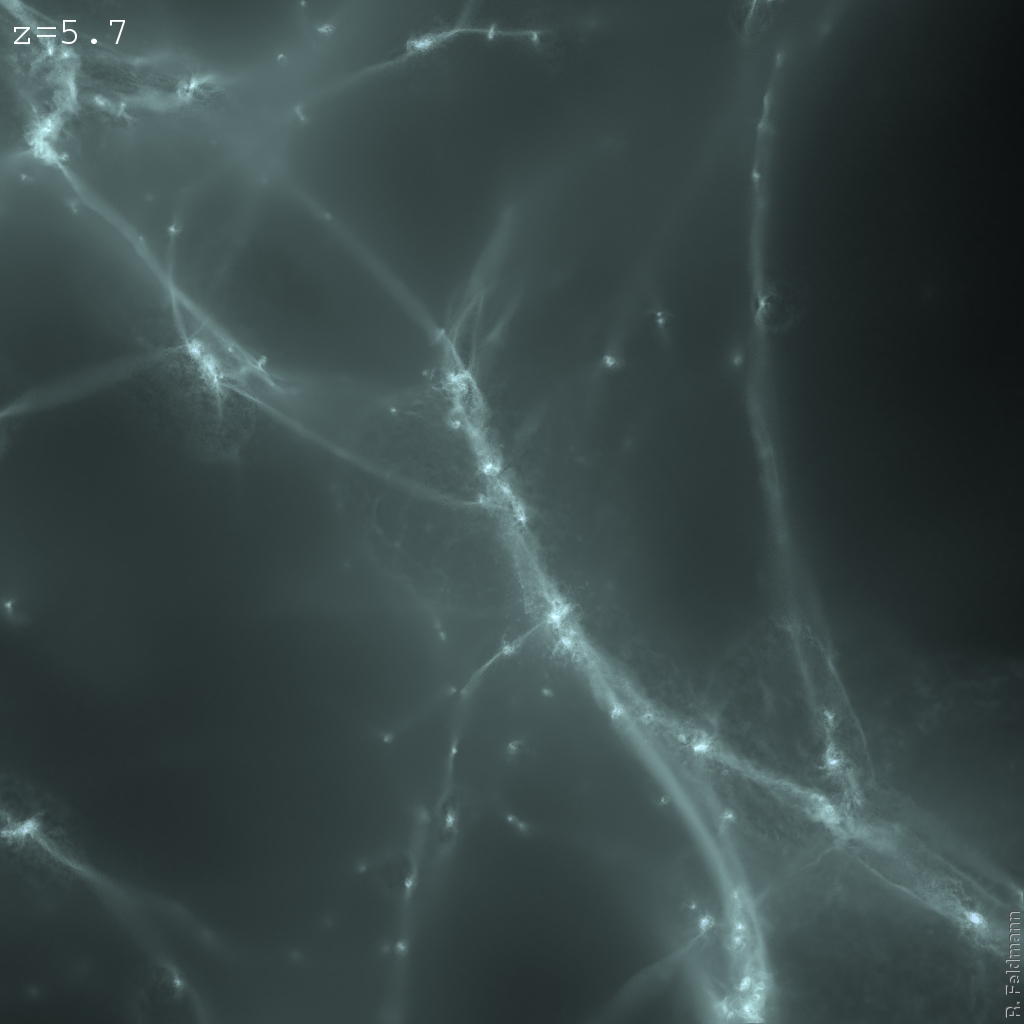 |
Evolution of galaxies in the Argo simulation. The movie shows the gas surface density in green and stars in purple/yellow. [17 MB] |
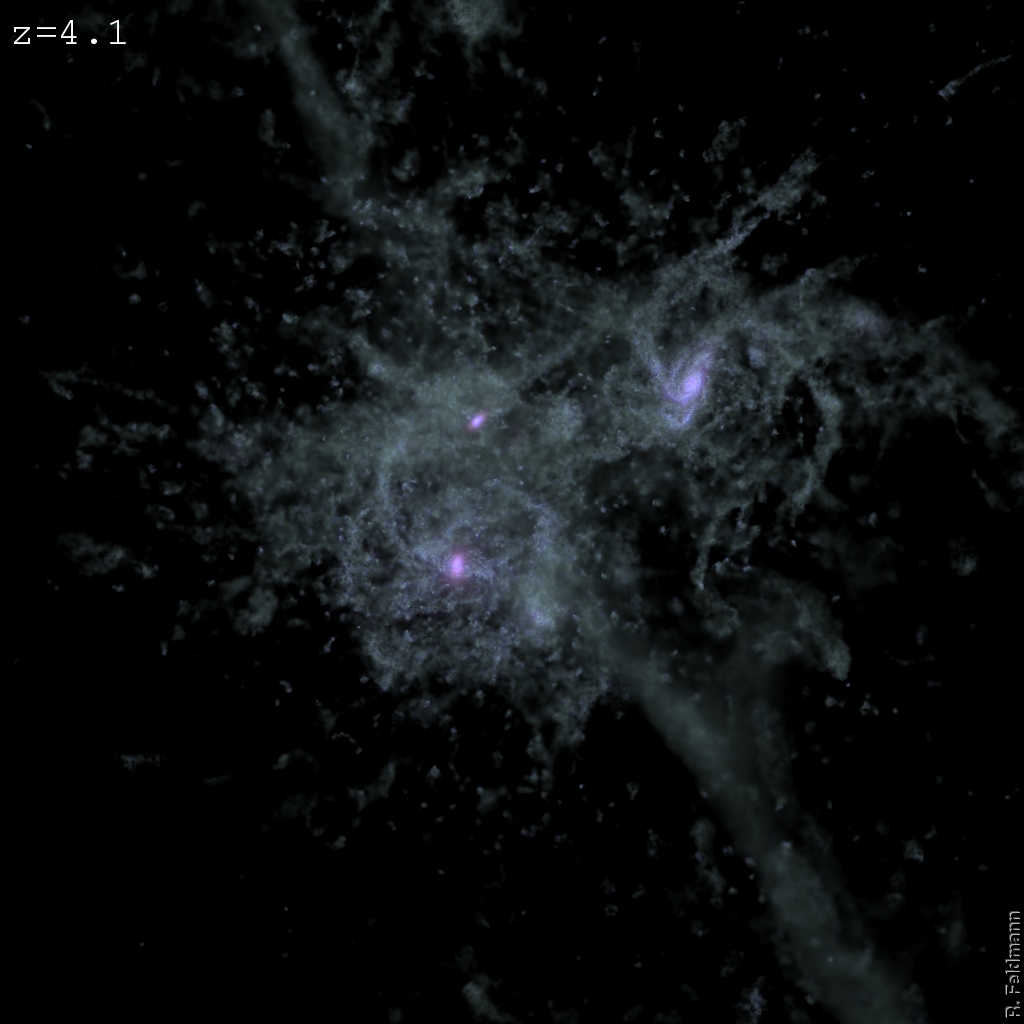 |
Zoom-in on the central galaxy in the Argo simulation. The movie shows the gas surface density in green and stars in purple/yellow. [18 MB] |
 |
This movie shows how a galaxy group forms and evolves with cosmic time. The color channels correspond to B, R, and I filter bands. [3 MB] |
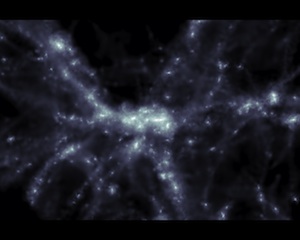 |
The Evolution of Galaxies in Cosmological Simulations. This movie was shown at the ETH Zurich Exhibition in the International Year of Astronomy 2009. [33 MB] |
Images
|
|
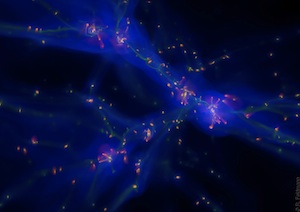
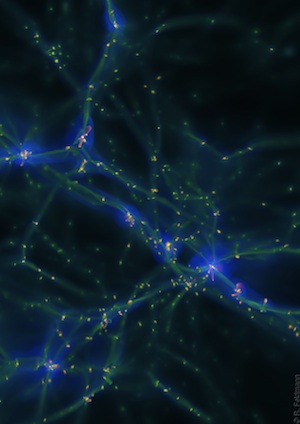
False color images of the intergalactic gas in a cosmological simulation of a galaxy group (click on image for high-resolution version). The shown region is approximately 0.6 Mpc (top left image) and 2 Mpc (other images) across. The simulation has been run with the AMR code RAMSES. The top and middle images on the left-hand side show gas density, gas metallicity, and gas temperature in the blue, green, and red color channel, respectively. For instance, hot un-enriched, diffuse gas is shown in red, dense, cool, metal rich gas in cyan, and dense, cool, unenriched gas in a dark blue. The other images show the same quantities but adopt different color-schemes. |
